Ludus Teaming
Table of Contents
TL;DR: Practical Purple Teaming = good book. Ludus + Splunk Attack range = good lab to supplement the book. Sent a few PRs that no one cares about along the way. My range configs are maintained in this repo.
Introduction
Hello world, this is a first post. I have been thinking about writing some ramblings for a while now, but I also did not want to turn this into another certifications review or box walkthrough blog (no offense to those who do that though), and so I have been waiting to have something more to say.
During the recent holidays, work, family and school related duties have slowed down, and I had a chance to continue reading Alfie Champion’s excellent book, Practical Purple Teaming. Up until recently, I knew nothing at all about Purple Teaming, and I have been tearing through that book.
Champion encourages the reader to build a lab in AWS using the super cool Splunk Attack Range project to put into practice what is shown. There is also a brief allusion that it is also possible to build such an environment on good ol’ metal using Ludus.
While I could 100% use some practice in AWS, I also am a big Ludus fan. I already have a mini-PC running it at home, so I took on a side quest to replicate the lab environment shown in the book as closely as possible in Ludus. Some parts were plug-and-play because the Splunk team has started to port the range to Ludus, but other parts required a bit of tinkering. I figured that posting about this quest could be of interest, and maybe encourage you to also jump on the Ludus train to build some roles.
Suggested lab architecture
The suggested lab looks like the following, deployed in AWS using the Splunk Attack Range Python script. Please don’t mind the loosely-made diagram.
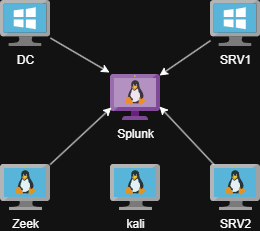
AWS Attack Range architecture
Additionally, the Active Directory domain is filled with mock data coming from the BadBlood project, and the free version of the Aurora EDR Agent is installed on both Windows hosts.
These tools are also meant to be installed manually later on:
Obviously, the telemetry generated by all those components—including Zeek, Sysmon, PowerShell, and others—is automatically forwarded to Splunk for you in typical Splunk Attack Range fashion. Happy days.
However, we are on a side quest here. What about Ludus?
Current state of Splunk Attack Range in Ludus
The starting point here is the corresponding Environment Guide in the Ludus docs. The heavy lifting is already done here by the Splunk team.
The main roles available are the following:
| Role | Description |
|---|---|
p4t12ick.ludus_ar_splunk | The actual Splunk server installed on Ubuntu - sets up indices, Splunk, installs apps, etc. |
p4t12ick.ludus_ar_windows | Installs the Splunk Universal Forwarder, sysmon, enables some auditing, enables collection of some log sources (PowerShell, sysmon, and more) and automatically forwards them to your Splunk instance, also downloads Atomic Red Team. This gets us to a similar situation as our SRV1 machine in the Suggested lab architecture. |
p4t12ick.ludus_ar_linux | Installs the Splunk Universal Forwarder, auditd, sysmon, osquery, pushes some configs, enables collection of events and forwards them to Splunk as well. This gets us to a similar situation as our SRV2 machine. |
What is missing for us to reproduce the lab? Not much, but there are a few tools to enable if we want the whole thing:
- BadBlood or something similar if we want user data in our AD
- Aurora EDR
- Zeek
- Caldera, Mythic, and VECTR if we want to automatically deploy those
It is important to note that P4T12ICK seems pretty active these days with role development, so it is quite clear that the picture could change soon as more stuff is added to the Ludus flavor of Splunk Attack Range.
The missing pieces
BadBlood
The role repertoire available in Ludus (and Ansible for that matter) keeps growing, and our job is made easy here since Jason Lang (curi0usJack) has published a Ludus-specific role for BadBlood. You can just add the role to your DC machine in your Ludus range config, and away you go. Bad stuff appears all over your AD.
One caveat though: I had trouble deploying the role myself. It seems that the role includes some logic to download the Git installer that was broken by some changes on the Git side. I have made a very simple fix and pushed a PR to the role repo, if it makes anyone’s life easier.
Note that you have options here if you want to easily add some stuff to AD. For example, you could use the ludus-ad-content role to add users, groups and OUs automatically in AD, and/or the ludus-ad-vulns role if you want to introduce common vulnerabilities on those objects.
BadBlood is cool as a “set-and-forget” option though.
Aurora EDR
Again, we are in luck because user frack113 has already published an Aurora role for Ludus. You can simply request your free license for Aurora, drop your files on your Ludus host (check the role’s documentation), add the role to your Windows hosts, and deploy. However, if you want to send that new telemetry to Splunk, you need to take a few actions first. Namely, setting the logs to JSON format, and grabbing them with the Universal Forwarder. Also, you will need to make sure you install the Aurora app (TA) on your Splunk server to parse the logs correctly.
For the Windows host side, I have pushed a small PR to the Aurora role to make it more seamless when installing the role. If you set the ludus_aurora_splunk_forwarder variable to true, it will take care of all the Splunk parts for you. It is heavily inspired by the Splunk Attack Range Ansible tasks where Aurora is included.
For the Splunk server side, the ludus_splunk_apps variable in the ludus_ar_splunk role does let you install more apps, so you can add the Aurora TA app there. Thankfully, it seems it is on their S3 bucket used to fetch the files, most likely because that’s how they install it in the original project as well. This means no modifications are needed to the role.
    role_vars:
      ludus_splunk_apps:
        - splunk-add-on-for-microsoft-windows_901.tgz
        - splunk-add-on-for-sysmon-for-linux_100.tgz
        - splunk-add-on-for-sysmon_402.tgz
        - splunk-add-on-for-unix-and-linux_1000.tgz
        - splunk-common-information-model-(cim)_602.tgz
        - DA-ESS-ContentUpdate-latest.tar.gz
        - TA-aurora-0.2.0.tar.gz
Do note that it is very possible that the Splunk team eventually releases an “official” way to add Aurora to the Ludus flavor of Splunk Attack Range which would render all this redundant, but this seems like a good workaround in the meantime.
Zeek
Next up is Zeek, a popular network capture and monitoring tool. Initially, I took a quick glance at the Ludus roles page and did not see a Zeek role. I then figured I would spin up a quick role, which is actually pretty fun and easy, especially assisted by a helpful AI agent. The dev guide has everything you need, including the link to a role template which you can clone and start with.
Plot twist though: when my role was ready to be published to Ansible Galaxy, I noticed that there was already an “official” Zeek role for the Ludus version of Splunk Attack Range, already handling all the Splunk stuff. I had totally missed it. There was then no reason at all to make a new role. Oh well, lesson learned, always look up on Galaxy before starting a new role, folks ¯\(ツ)/¯.
I kept the role around just in case some people want to use Zeek without the Splunk range parts and just have an easy quick way to add Zeek to a Ludus range. However, this experiment still taught me a few things about packet capture on a Proxmox VM that I can share here.
First of all, Zeek won’t be able to capture any traffic destined to other VMs in your range unless you make a small change on the network bridge used by the range on your Ludus host itself. This is nicely documented here.
Now, even after changing this, Zeek was capturing next to no packets, despite seeing all the juice on the “virtual wire” with tcpdump. After going through Zeek’s documentation a few times, something finally caught my eye.
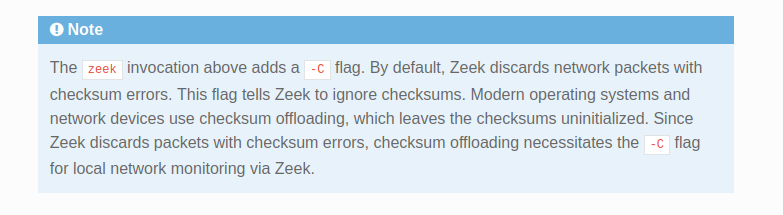
Important note in Quickstart
I admittedly know very little about virtual networking, but apparently there is a whole lot of checksum offloading going on here. I briefly tried to disable some of that stuff on the Zeek VM, but it was inconclusive and seemed complicated, and after some Googling I found out that you can add a setting in your Zeek config that does the same as the -C flag described in the documentation.
# Ignore checksum errors - seems needed for Proxmox virtual NICs
redef ignore_checksums = T;
With that added, Zeek was finally happy, capturing a bunch of data and sending its logs to Splunk. I have added the P4T12ICK.ludus_ar_zeek role to my range since then, and noticed the same issue. I have pushed a humble PR to propose the same fix.
Attacker’s side
The book also takes the reader through some attack emulations using Caldera and Mythic C2, while exploring VECTR for assessment tracking as well. I knew for a fact there were already Ludus roles for all of these, especially since I published a VECTR role myself recently. The role’s page has links for most of them, otherwise you can search on Galaxy too.
The roles I’ve gone with are in the following table, but do note that there are often alternative roles as well that you can try.
| Tool | Role | Alternatives |
|---|---|---|
| Caldera | frack113.ludus_caldera_server and optionally frack113.ludus_caldera_agent if you want to deploy the agent automatically | p4t12ick.ludus_ar_caldera |
| Mythic | 0xRedpoll.ludus_mythic_teamserver | Ansible Galaxy has a few others |
| VECTR | 5tuk0v.ludus_vectr | inf0junki3.ludus.vectr (collection) |
There is not much to say here: everything deployed as it should. I did choose to keep a second Ludus range dedicated to those tools, simply because it seemed easier to manage them separately from the “client’s environment” and because it is a scenario that feels a bit more like what I would expect to see in my current job’s context.
One thing that might be worth mentioning is that if you want a VM to access a service in another range (for example, an implant in range A beaconing back to the C2 server in range B), you need to allow it in the iptables rules of the destination range’s router. Unless I’m wrong here, I believe the ranges are made to be independent from one another, which makes total sense, and so the rules settings that are exposed to the user in a range’s config are only for communications inside the range and won’t help in this scenario. I then SSH’d into the “attacker’s side” router and punched a few holes to be used by Caldera and Mythic agents.
sudo su
iptables -I LUDUS_DEFAULTS -i ens18 -s 192.0.2.105 -d 10.2.10.11 -p tcp --dport 8888 -j ACCEPT -m comment --comment "Allow C2 traffic to Caldera Server"
iptables -I LUDUS_DEFAULTS -i ens18 -s 192.0.2.105 -d 10.2.10.12 -p tcp -m multiport --dports 80,443 -j ACCEPT -m comment --comment "Allow C2 traffic to Mythic C2"
iptables-save > /etc/iptables/rules.v4
I believe I picked up this trick from Erik on the Ludus Discord. After this, I was able to get callbacks on those specific ports and to those specific hosts in the attacker’s range, from the defender’s range.
Final state
If you’ve followed this far, I have no clue how you found your way through all this rambling! You might have noticed that we now have two Ludus ranges: one simulating a client’s environment with a small network/AD and monitoring tools, and another simulating a purple team operator doing an assessment with the client’s blue team, hosting its tools externally (let’s say the cloud). I made a quick diagram to better visualize the setup.
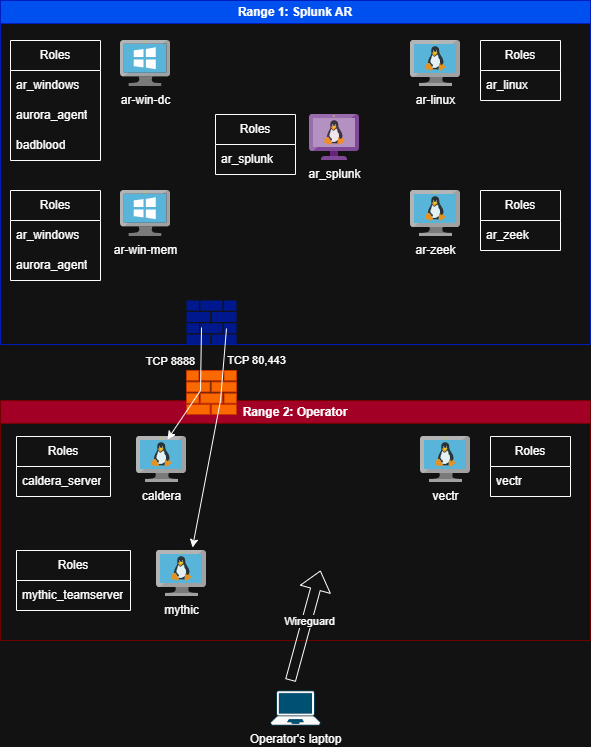
Ludus Attack Range architecture
I’ve been maintaining my regular range config files in this repo, so feel free to grab them in case they’re useful to you.
Conclusion
I think that with this setup, you can achieve a pretty good adaptation of the Splunk Attack Range proposed in the book. It was a lot of fun to figure out and it allowed me to make small contributions to community-made roles. This setup let me deploy a repeatable lab on-premises for free to practice methodologies and tooling. I have changed very little after my last deployment, namely enabling some more audit logs and PowerShell transcriptions as I progress in the book.
My short attention span is already tempting me elsewhere after building the lab, but I’d like to find some time to get more comfortable with Caldera and VECTR and build a basic purple teaming methodology. I also want to get more familiar with running Atomic Red Team tests. I am also a complete noob with SIEMs. In my line of work, I would be very surprised if I ever came across an organization using Splunk, but I’m sure the general principles and concepts can be applied to most other solutions as well.
That is all that I have to share for now. I hope this was useful to you. Have fun!